
When investing in solar panels, a key consideration is the payback period — the point at which accumulated energy savings offset the initial installation costs.
This timeline varies based on several measurable factors, including geographic location, system size, local utility rates, and available financial incentives such as tax credits or rebates.
Because these variables differ significantly across regions and individual circumstances, payback periods can range widely, typically falling between six and twelve years for residential installations.
Accurately calculating this timeline requires evaluating each factor systematically to determine whether a solar investment aligns with one’s financial objectives.
Key Takeaways
The solar payback timeline refers to the period required to recover installation costs through accumulated electricity bill savings, generally falling between 5 and 14 years depending on individual circumstances. This range reflects the variability in conditions that affect how quickly a system reaches its break-even point.
Geographic location, local electricity rates, and system size are among the primary factors determining the length of the payback period. Regions with higher electricity rates or greater solar irradiance tend to produce shorter payback timelines, as the financial offset against utility bills is more substantial on an annual basis.
Available financial incentives, including federal tax credits and state-level rebates, reduce the effective upfront cost of installation. This reduction in initial expenditure directly shortens the payback period, making these incentives a meaningful variable in any cost-recovery calculation.
The inclusion of battery storage systems introduces additional upfront costs that are not typically offset by proportional increases in annual savings. As a result, systems incorporating battery storage generally carry longer payback periods, often extending into the 12–15 year range.
Panel efficiency also influences the payback timeline. Higher-efficiency panels tend to generate more electricity per unit of installed capacity, contributing to payback periods in the 6–10 year range. Conversely, lower-cost, lower-efficiency systems may produce payback periods between 9 and 12 years, reflecting the trade-off between reduced initial costs and diminished energy output over time.
What Is the Solar Payback Timeline?
The solar payback timeline refers to the length of time required to recover the upfront cost of a solar installation through accumulated electricity bill savings. Several variables influence this period, including local electricity rates, system size, and applicable incentives or rebates.
To calculate the payback period, subtract any available incentives from the total system cost, then divide the resulting figure by the estimated annual savings on electricity bills. Based on this calculation, most U.S. homeowners recover their investment within 5 to 14 years, depending on their specific circumstances.
Homeowners in regions with higher electricity rates tend to experience shorter payback periods, as their annual savings are proportionally greater. Conversely, areas with lower electricity costs or limited solar incentives may result in longer timelines. Federal tax credits, state rebates, and net metering policies can also meaningfully reduce the effective cost of installation, shortening the payback period.
Understanding the payback timeline is a practical step in evaluating whether a solar investment aligns with a homeowner’s financial goals and expected duration of residence. In Connecticut, homeowners may qualify for a 30% federal tax credit on total system costs, which can significantly reduce the upfront investment and accelerate the payback timeline.
How Long Does Solar Take to Pay for Itself in the UK?
For UK homeowners, solar payback periods typically range from 8 to 12 years, varying based on system size, geographic location, and applicable incentives. A 5 kW system with a net installation cost of £7,000 generates approximately £850 in annual savings, resulting in a payback period of around 8.2 years. Smaller residential systems of 3–4 kW generally have longer payback periods of 9–12 years, as their lower energy output produces proportionally reduced savings. Commercial solar installations tend to achieve payback within 6–8 years, largely due to higher daytime energy consumption patterns and available tax advantages. The overall return on investment improves over the operational lifespan of the system, which typically extends 25 years or more beyond the initial payback period.
How Location, Rates, and System Size Shape Your Timeline
Location is one of the primary factors determining how long it takes for a solar system to recover its initial cost. Regions with higher solar irradiance, such as the southwestern United States, generate more electricity annually, which reduces the payback period. In these areas, payback periods typically fall within the 6–8 year range. In contrast, regions with lower sunlight levels, such as northern Europe, will generally see longer payback timelines.
Local electricity rates also play a significant role. When utility rates exceed $0.15/kWh, the financial value of each unit of solar energy produced increases, which can bring the payback period down to approximately 5–7 years. In areas with lower electricity costs, the savings accumulate more slowly, extending the timeline accordingly.
System size relative to actual energy consumption affects outcomes as well. An undersized system leaves a portion of electricity demand unmet, reducing total savings, while an oversized system may produce excess electricity that cannot always be fully monetized depending on local policies.
Financial incentives, including federal tax credits and state or regional rebates, reduce the net upfront cost of installation, which directly shortens the payback period. Net metering policies, where available, allow system owners to receive credit for surplus electricity fed back to the grid, providing additional financial return. The extent of these benefits varies by jurisdiction and should be evaluated on a case-by-case basis when estimating a realistic payback timeline.
What Speeds Up or Slows Down Your Break-Even Point?
Several variables influence the timeline for reaching your solar break-even point. Higher utility rates increase annual electricity savings, which reduces the overall payback period. The federal solar tax credit lowers initial installation costs, which can move the break-even point earlier in the system’s lifespan. Net metering policies, where available, allow homeowners to receive credits for excess energy sent back to the grid, contributing to overall financial returns. Accurate system sizing relative to actual energy consumption helps avoid unnecessary expenditure while maintaining adequate output. On the other hand, lower utility rates reduce the value of electricity savings, while shading, suboptimal panel orientation, or inadequate system design can limit energy production and extend the time required to recover installation costs.
How Does Adding a Battery Affect Your Solar Payback Period?
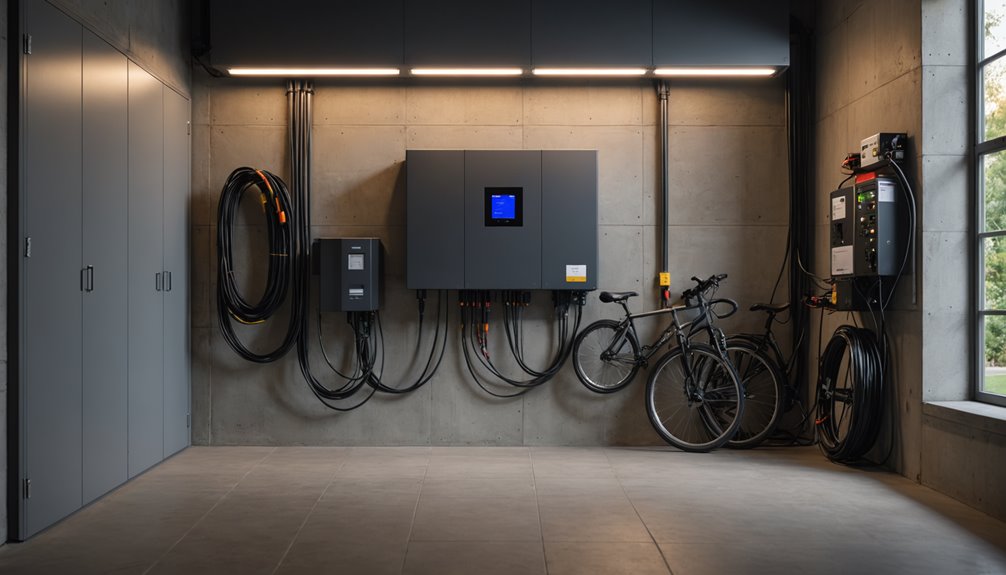
Adding a battery storage system to a solar installation increases upfront costs by several thousand dollars, which typically extends the payback period from the standard 8–12 years to approximately 12–15 years. This occurs because annual electricity bill savings generally do not increase proportionally to offset the higher initial investment.
The financial case for batteries depends largely on local utility policies. In regions where net metering programs are restricted or unavailable, a battery allows homeowners to store excess solar energy and use it during peak-rate hours, which can improve the overall return on investment over time. In areas with full retail net metering, the financial benefit of adding a battery is more limited, as excess energy sent to the grid already receives fair compensation.
For homeowners prioritizing energy independence or grid resilience over a shorter payback timeline, a battery system remains a viable long-term consideration. However, those whose primary objective is maximizing financial return should weigh the extended payback period against their specific utility rate structure and net metering availability before committing to battery storage.
Is Solar ROI the Same as Payback Period?
Solar ROI and payback period are related but distinct financial metrics. The payback period measures the time required to recover the initial investment through accumulated savings, typically ranging from 6 to 12 years for residential solar installations. ROI, by contrast, measures the total financial return generated by the system relative to its cost over its entire operational lifespan, which commonly spans 25 to 30 years.
A shorter payback period indicates faster cost recovery, while a higher ROI reflects greater overall profitability. The two metrics can point in different directions; a system with a relatively short payback period does not necessarily produce the highest long-term ROI, as factors such as system degradation, maintenance costs, and local electricity rates influence total returns over time.
Evaluating both metrics together provides a more complete picture of a solar installation’s financial performance. The payback period addresses short-term cost recovery, while ROI captures the broader economic value of the investment across its full service life.
How to Calculate Your Solar Payback Period
Calculating the solar payback period involves dividing the net system cost by the annual savings generated. The net system cost is determined by subtracting applicable incentives, such as federal tax credits or state rebates, from the total installation cost. That figure is then divided by the estimated annual savings on electricity bills.
As an example, a system with an $18,000 installation cost, after incentives are applied, divided by $2,250 in annual electricity savings, produces an 8-year payback period.
The accuracy of this calculation depends on the reliability of several inputs, including local electricity rates, the system’s projected energy output, permitting fees, and total installation expenses. Electricity rates vary by region, which directly affects the annual savings figure. Homeowners in areas with higher electricity costs will generally see larger annual savings, resulting in a shorter payback period compared to those in lower-rate markets.
It is also worth noting that electricity rate changes over time, solar panel degradation, and shading or weather conditions can affect actual savings and shift the payback period from initial estimates. Using conservative, well-researched figures for each variable produces a more dependable calculation and supports a more informed assessment of the financial return on a solar installation.
Do Cheaper Solar Panels Speed Up Your Solar Payback?
Choosing cheaper solar panels reduces upfront installation costs, but this does not necessarily shorten the payback period. Lower-cost panels typically operate at reduced efficiency levels, meaning they generate less electricity over time. This decrease in energy output can offset the initial savings achieved through lower purchase prices.
Data on payback periods reflects this trade-off. Budget solar panel systems generally require 9–12 years to recover their costs, while higher-efficiency premium systems often achieve payback within 6–10 years. The difference stems from the greater annual energy savings that higher-performing panels produce over their operational lifespan.
Panel longevity is another relevant factor. Less expensive panels may have shorter manufacturer warranties and degrade at faster rates, reducing their total energy output over a 25–30 year period. Premium panels, by contrast, tend to maintain higher performance levels longer, increasing cumulative savings.
When evaluating a solar investment, the upfront cost represents only one variable. Annual energy production, local electricity rates, degradation rates, and system lifespan all influence the total financial return. A lower purchase price does not automatically translate to faster cost recovery if the system underperforms relative to higher-quality alternatives over the same period.
Conclusion
The solar payback timeline represents the period required for accumulated energy savings to offset the initial system investment. Several key factors determine this timeline, including geographic location, local electricity rates, system size, and applicable incentives such as tax credits or rebates. These variables interact to produce payback periods that typically range from 6 to 12 years for residential installations in the United States.
Adding a battery storage system increases upfront costs, which extends the payback period. However, batteries can improve long-term financial returns by reducing reliance on grid electricity during peak-rate hours, depending on local utility pricing structures.
It is worth noting the distinction between payback period and return on investment (ROI). The payback period measures only the time required to recover the initial cost, while ROI accounts for the total financial gain over the system’s lifespan, typically 25 to 30 years. A system with a longer payback period may still generate a strong ROI if it continues producing savings well beyond the break-even point.
Calculating these figures requires accurate data on current electricity rates, projected rate increases, local solar irradiance levels, and the full installed cost of the system after incentives. Consulting utility bills and obtaining multiple installer quotes provides the most reliable basis for this analysis.