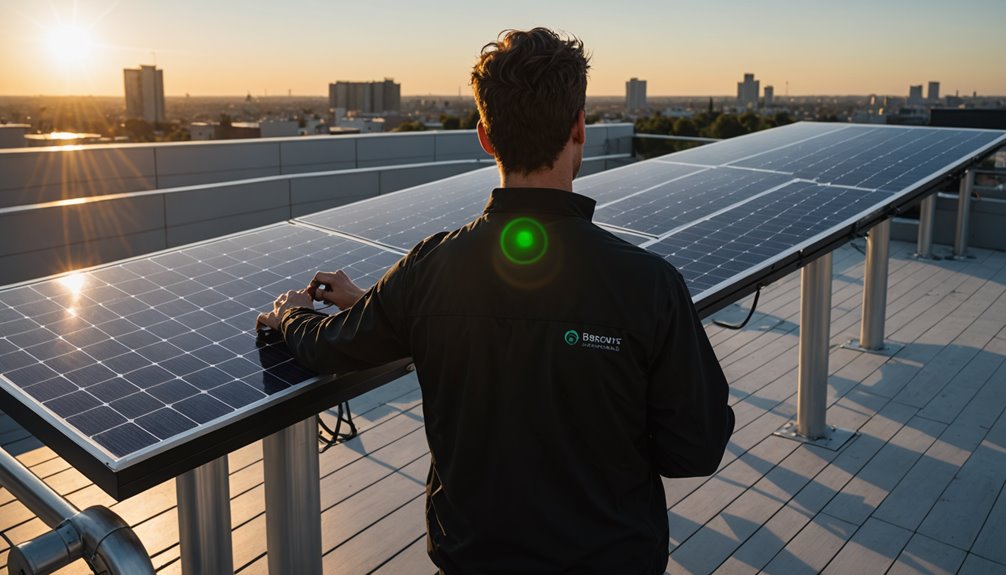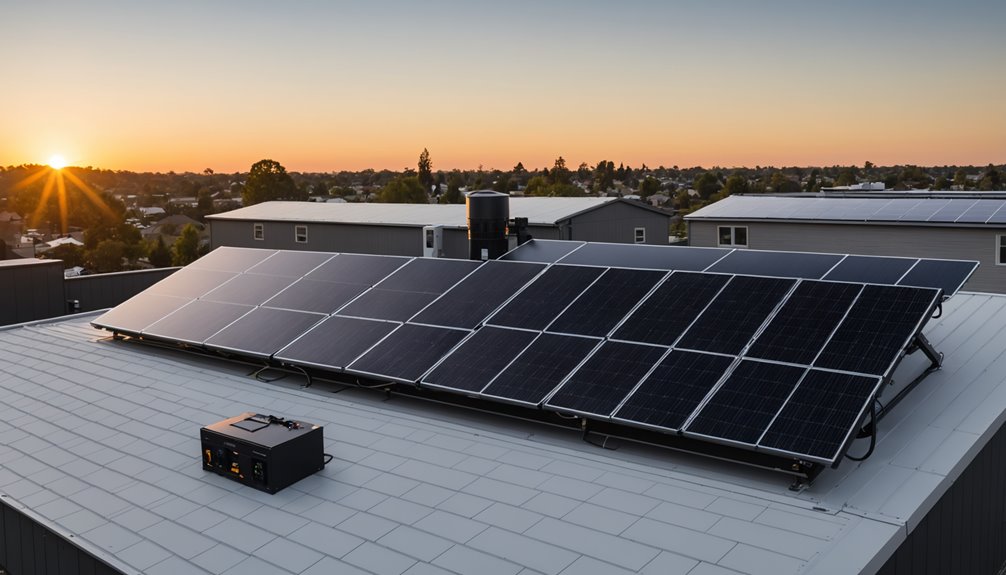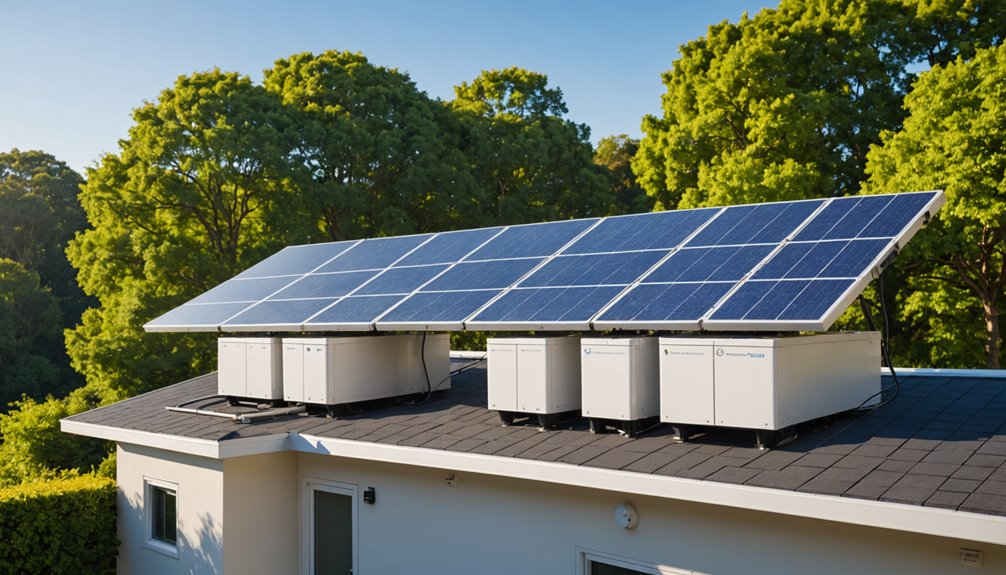
Residential rooftop solar remains a viable financial investment in 2026 for some homeowners, though the calculus depends on several specific variables. The expiration of federal tax credits has meaningfully altered the return-on-investment timeline, and upfront installation costs typically range from $18,000 to $25,000 depending on system size, roof condition, and regional labor rates.
Key factors that determine financial outcomes include local utility electricity rates, available state or municipal incentive programs, net metering policies, roof orientation and sun exposure, and the homeowner’s expected tenure in the property.
In high-electricity-cost states with favorable net metering policies, payback periods generally fall between 7 and 12 years, after which energy savings accumulate with minimal additional cost. In states with low utility rates or restrictive net metering structures, payback periods can extend beyond 15 years, reducing the overall financial case.
System lifespans average 25 to 30 years, and cumulative savings over that period can be substantial in favorable conditions, though projections vary based on future utility rate changes, which are not guaranteed.
Financing arrangements such as loans, leases, and power purchase agreements alter the financial profile significantly and warrant careful comparison before committing.
Homeowners considering solar should obtain multiple installation quotes, review their utility’s current net metering policy, consult their state’s energy office for active incentive programs, and calculate projected savings using realistic rather than optimistic utility rate escalation assumptions.
Key Takeaways
Residential rooftop solar presents a mixed financial picture in 2026. The expiration of the federal residential solar tax credit has increased upfront costs, though homeowners in states like Oregon and New York retain access to supplementary financial programs that partially offset this burden.
The baseline cost of an average solar installation sits at approximately $30,000 before incentives, with a projected payback period of around 10.1 years. This timeline is sensitive to several variables, including local electricity rates and roof orientation. Homes with south-facing roofs and electricity rates exceeding 15¢/kWh tend to yield stronger financial returns, as higher utility costs accelerate savings accumulation.
Beyond energy savings, solar installations have demonstrated an ability to increase home resale value by roughly 5–10%, a factor that adds relevance for homeowners planning to remain in their properties over the long term.
Conversely, solar investment carries limited financial logic for certain groups. Renters lack the ownership stake needed to recoup installation costs, while frequent movers may not hold a property long enough to reach the payback threshold. Homes with north-facing or heavily shaded roofs also face reduced energy generation, weakening the overall return on investment.
In summary, solar viability in 2026 depends heavily on individual circumstances, including ownership status, geographic location, roof characteristics, and local energy pricing. A careful assessment of these factors is advisable before committing to an installation.
What Does Residential Rooftop Solar Cost in 2026?
Residential solar installation costs in 2026 range from $2.30 to $3.60 per watt. For an 8 kW system, this translates to a total cost between $18,400 and $28,800 before any incentives are applied. Local electricity rates are a significant factor in determining the payback period. In states like Massachusetts, where utility rates are higher than the national average, the upfront investment is greater, but the corresponding savings on electricity bills are also higher.
Without the federal investment tax credit, and after applying available local incentives, Massachusetts homeowners can expect total system costs to fall between $28,000 and $42,000. This figure underscores the substantial role federal incentives play in reducing the financial burden of solar adoption.
System performance variables, including roof orientation, shading, and regional solar irradiance, will directly affect energy output and, by extension, the return on investment. Establishing an accurate cost baseline specific to your location, system size, and available incentives is a necessary first step before evaluating whether a solar installation is financially viable. Homeowners who qualify for the federal 30% tax credit can significantly reduce their net system costs, making the overall investment considerably more accessible.
Is Your Home a Good Candidate for Solar?
Determining whether a home is suitable for solar installation requires evaluating several physical and financial factors. Roof orientation plays a significant role, with south or southwest-facing surfaces receiving 4-5 hours of direct sunlight daily producing the most energy output. North-facing or heavily shaded roofs typically generate 25-40% less electricity, which extends the time needed to recover installation costs.
Electricity rates are another relevant variable. Homes in areas where rates exceed 15¢/kWh tend to see stronger financial returns from solar systems, with potential savings estimated at $61,093 over a 25-year period under favorable conditions. Roof condition should also be assessed prior to installation, as addressing any necessary repairs or replacements beforehand prevents the added expense of removing and reinstalling panels later.
Finally, the expected duration of homeownership affects the financial outcome. Solar systems typically require around 10 years to reach payback, meaning homeowners who plan to sell before that point are unlikely to recover their investment, even accounting for any increase in property value associated with having solar panels installed.
When Solar Panels Probably Aren’t Worth It
Solar panels are not a suitable investment for all homeowners. Renters typically cannot pursue permanent installation without explicit landlord authorization. In regions where electricity rates fall below 10¢/kWh, the payback period extends considerably, reducing the financial case for installation. Roof characteristics also play a significant role; heavy shading, north-facing orientation, and insufficient annual sunlight hours directly reduce system output and overall efficiency.
Homeowners who anticipate selling their property within ten years may not recover installation costs through either energy savings or increased property value. Solar lease agreements present additional complications, as they involve long-term contractual obligations that can create difficulties during property transfers or relocation.
A thorough assessment of local electricity rates, roof suitability, ownership timeline, and financing structure is necessary before proceeding. The decision should be based on these concrete variables rather than general assumptions about energy savings or property appreciation.
How Long Until Solar Pays for Itself?
How long it takes for solar panels to pay for themselves depends on several variables specific to each household. Installation costs, local electricity rates, and available incentives all influence the payback period. A typical residential solar installation costs approximately $30,000 before incentives. After applying the federal tax credit and applicable state incentives, the net cost is reduced. Most homeowners reach their break-even point in approximately 10.1 years. With average annual savings of $2,475 and electricity rates increasing at roughly 2.8% per year, a residential solar system can produce substantial long-term savings over a 25-year period, with estimates ranging from $37,000 to $154,000 depending on location and energy consumption.
The Variables That Determine Your Actual Savings
The 10.1-year average payback period serves as a general benchmark, not a definitive outcome. Several factors influence actual savings. Electricity rates above 15¢/kWh shorten the payback period, while rates below 10¢/kWh can extend it to approximately 15 years. Installation costs average $2.58 per watt before accounting for the solar investment tax credit and applicable local incentives. Net metering policies determine the credit value assigned to excess energy returned to the grid. Roof orientation and shading conditions directly affect system output and overall efficiency. Evaluating these variables provides a more accurate projection of financial returns prior to making a solar investment.
Cash Purchase, Loan, or Lease: The Real Cost Difference
Selecting a financing method for solar installation has significant implications for long-term financial outcomes. A cash purchase typically results in the shortest payback period, approximately 10.1 years, and yields the highest lifetime energy savings by eliminating interest costs entirely. Financing through a loan allows the buyer to retain system ownership while distributing the installed cost across a repayment term ranging from 5 to 25 years; however, accumulated interest reduces the overall financial return compared to an outright purchase. A lease or power purchase agreement (PPA) reduces initial expenditure but generally produces the lowest net financial benefit over the system’s lifespan, as savings are shared with the third-party owner. With residential solar currently averaging $2.58 per watt installed, the choice of financing structure directly affects the system’s return on investment. A thorough comparison of each option against current electricity costs and projected future energy consumption is advisable before committing to a financing arrangement.
What Solar Incentives Are Still Available in 2026?
The federal residential solar tax credit (Section 25D) expired as of 2026, removing a previously significant financial incentive for homeowners considering solar installations. However, a range of state and local programs remain in place that can help offset installation costs.
Oregon’s rebate program offers $2,500 for standard applicants, with that figure increasing to $5,500 for income-qualified households. In New York, the NY-Sun program continues to provide financial incentives, as does New Jersey’s Successor Solar Incentive program, though the value of these programs varies based on individual eligibility criteria and program availability at the time of application.
Many state-level incentive programs operate on a block funding structure, meaning available funds are finite and disbursed on a first-come, first-served basis. Once a funding block is exhausted, applicants must wait for the next allocation, which is not guaranteed to materialize on a predictable schedule.
Homeowners evaluating solar investment should consult the DSIRE (Database of State Incentives for Renewables and Efficiency) to identify currently active programs in their jurisdiction. Program terms, funding availability, and eligibility requirements change periodically, making it advisable to verify current conditions directly through official state or program sources before making installation commitments.
Does Adding a Battery Make Solar Worth More?
Adding a battery to a solar system affects its long-term value in several measurable ways. A battery stores surplus energy generated during daylight hours and makes it available during periods of higher consumption, which can reduce reliance on grid electricity and lower monthly utility costs. It also provides a degree of backup power during outages, though the duration and capacity depend on the size of the battery and the household’s energy consumption.
In utility markets that use time-of-use pricing, a battery allows homeowners to draw on stored solar energy during peak rate periods rather than purchasing electricity at higher costs from the grid. In areas with net metering policies, excess energy can be exported to the grid in exchange for credits, which offsets future electricity costs. The financial benefit of either arrangement depends on local utility rates, net metering compensation structures, and the specific terms set by the utility provider.
Whether a battery meaningfully improves the overall return on a solar investment depends on factors including installation costs, local electricity rates, applicable incentives such as the federal Investment Tax Credit, and how much excess solar energy a system consistently produces. In some markets, the payback period for a battery can be longer than for solar panels alone, making it important to evaluate the decision based on regional conditions and individual energy use patterns rather than as a universal financial benefit.
How Solar Panels Affect Your Home’s Resale Value
Solar panels can increase a home’s resale value by approximately 5–10%, with research citing an average premium of around 6.8% compared to similar homes without solar installations. This value increase is more pronounced in markets where electricity rates are higher, as prospective buyers tend to place greater weight on long-term utility cost reductions. Homes with solar installations may also sell more quickly, as energy efficiency features are increasingly considered a practical asset rather than simply an aesthetic one.
That said, the financial benefit of selling a solar-equipped home depends on several variables. If a homeowner sells before recovering the installation cost through energy savings or available tax incentives, the net financial outcome may be less favorable. The age and condition of the system, local electricity prices, and whether the panels are owned outright or subject to a lease agreement can all influence how buyers and appraisers assess the added value. Leased systems, in particular, may complicate the sale process, as the new owner would need to assume the lease terms.
Conclusion
The financial viability of residential rooftop solar in 2026 depends on several measurable factors. Roof orientation, local electricity rates, available incentives, and anticipated length of homeownership all significantly influence the return on investment.
Homes with south-facing, unobstructed roofs in regions with high electricity costs tend to generate the strongest economic case for solar installation. Federal tax credits, where applicable, can meaningfully reduce upfront costs, and net metering policies in certain states allow homeowners to offset their bills further by selling excess power back to the grid.
Conversely, properties with significant shading, low local utility rates, or owners planning to sell within a few years are less likely to recoup installation costs within a reasonable timeframe. The average payback period typically ranges from six to twelve years, depending on system size, local conditions, and financing arrangements.
Before committing to an installation, homeowners should obtain multiple quotes, review their local utility’s net metering terms, verify current federal and state incentive availability, and calculate projected savings based on actual energy consumption data. Third-party solar calculators and energy audits can provide a more precise financial projection than general estimates.
Solar remains a sound long-term investment for qualifying properties, but the decision warrants careful, data-driven analysis rather than assumptions based on broad market trends.