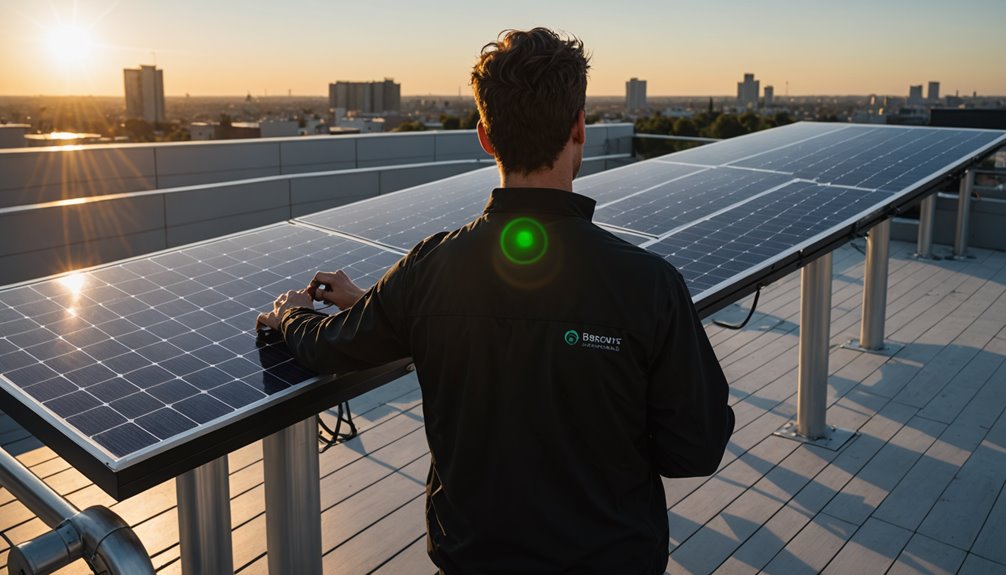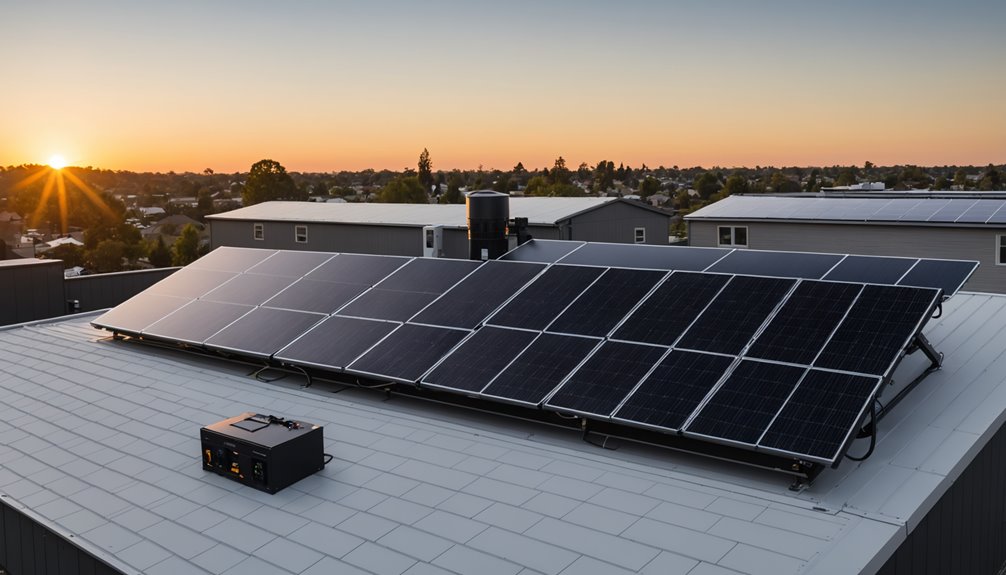

Homeowners who install rooftop solar panels can reduce or eliminate their monthly electricity bills, though the financial outcome varies based on several key factors.
Location plays a significant role, as states with high electricity rates and abundant sunlight — such as California, Hawaii, and Arizona — tend to produce stronger returns. A typical residential solar system in the United States saves homeowners between $10,000 and $30,000 over its lifespan, according to data from the National Renewable Energy Laboratory.
The method of financing also affects overall savings. Homeowners who purchase systems outright or through loans generally save more over time than those who use lease agreements, which transfer many of the financial benefits to the third-party owner.
Federal tax incentives, including the current 30% Investment Tax Credit, further reduce the upfront cost for those who own their systems.
Average payback periods range from six to twelve years, depending on system size, local utility rates, and available incentives. After that threshold, the energy generated represents direct savings for the remaining life of the panels, which typically spans 25 to 30 years.
Net metering policies, where available, allow homeowners to receive credits for excess electricity sent back to the grid, adding another layer of financial benefit. States without strong net metering protections may see reduced returns compared to those with favorable policies.
Key Takeaways
Homeowners who install rooftop solar panels typically see a reduction in monthly energy bills ranging from $40 to $300, depending on factors such as location, energy consumption, and system size. Over a 25-year period, cumulative savings can fall between $37,000 and $154,000.
The federal Investment Tax Credit currently permits homeowners to deduct 30% of installation costs from their federal taxes. Given average installation costs, this translates to approximately $9,000 in tax savings for most residential installations.
The standard payback period for a residential solar system is around nine years. Beyond that point, the system continues generating electricity at no additional fuel cost, allowing savings to accumulate through the remainder of the system’s operational life.
As utility electricity rates increase over time, the financial advantage of solar generation becomes more pronounced. Additionally, studies indicate that homes equipped with solar installations tend to carry higher resale values compared to comparable properties without solar systems.
The financing method chosen at installation has a measurable effect on long-term financial outcomes. Purchasing a system outright with cash typically yields the greatest total savings, as the homeowner retains full ownership of both the system and the energy it produces. Leasing arrangements or power purchase agreements, while reducing upfront costs, transfer a portion of the long-term financial benefits to the financing provider, resulting in lower overall returns for the homeowner.
How Much Can Rooftop Solar Actually Save You?
Rooftop solar savings depend primarily on geographic location, local electricity rates, and household energy consumption. Installation typically reduces monthly energy bills by $40 to $300. Over a 25-year period, cumulative savings range from $37,000 to $154,000, with variation driven largely by regional utility pricing. The current federal tax credit allows homeowners to deduct 30% of installation costs from their federal taxes, which amounts to approximately $9,000 in upfront cost reduction for an average system. The average payback period for a residential solar installation is approximately nine years, after which the system generates electricity at no additional fuel cost for the remainder of its operational lifespan. Actual savings are contingent on individual circumstances, including roof orientation, shading, local incentive programs, and net metering policies offered by the utility provider. Homeowners who generate surplus electricity can benefit from net metering credits, which allow excess power sent back to the grid to offset future utility bills.
What Determines How Much Electricity Your Panels Produce?
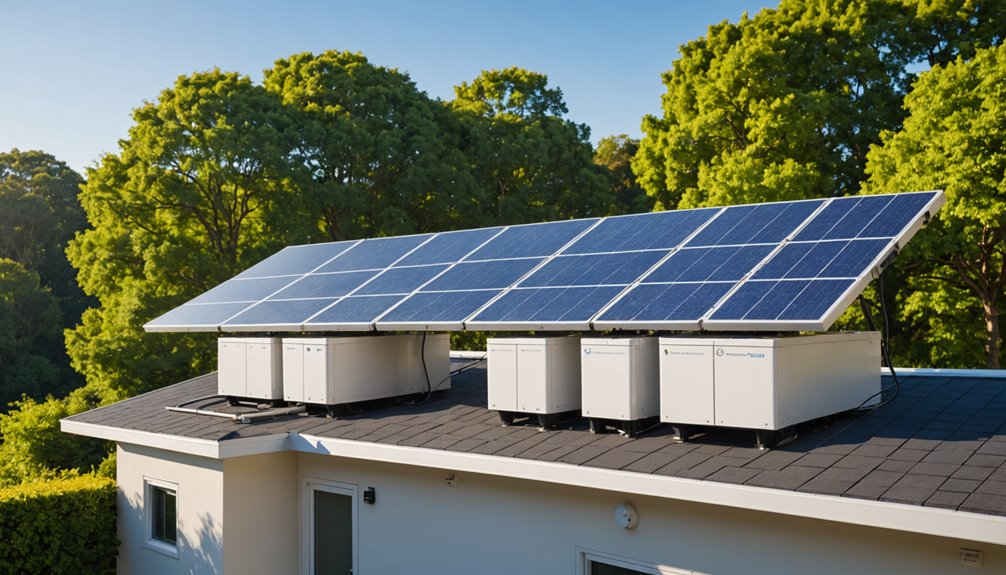
Several factors determine the amount of electricity a solar panel system can produce. Roof orientation plays a significant role, with south-facing slopes angled between 15° and 40° receiving the most consistent sunlight exposure throughout the day. System size is directly proportional to annual energy output; a 10 kW installation, for example, typically generates approximately 12,000 kWh per year under standard conditions.
Shading from trees, chimneys, or adjacent buildings can measurably reduce electricity production, making a thorough site assessment a necessary step before installation. The physical dimensions and configuration of the roof also affect how many panels can be installed, which in turn limits the system’s overall capacity.
Solar panel systems generally maintain reliable performance over a lifespan of 25 years or more, though output gradually declines over time due to natural degradation. Taken together, these variables — orientation, system size, shading, and available roof space — determine the total electricity a system can produce and, consequently, the degree to which it can offset household energy consumption.
How Does Your Monthly Usage Set Your System Size?
Monthly electricity consumption is the primary factor in determining the appropriate size of a solar panel system. The average U.S. household uses approximately 10,791 kWh of electricity annually, which generally corresponds to a system size of 5–10 kW to offset full energy demand. Monitoring monthly usage data allows homeowners to select a system capacity that matches actual consumption, reducing the risk of unnecessary expenditure on excess capacity.
From a cost perspective, rooftop solar installations average approximately $2.58 per watt before incentives are applied. A 10 kW system would therefore carry an estimated upfront cost of $25,800 prior to any federal tax credits or state-level rebates. Sizing a system in proportion to verified consumption patterns, rather than estimated or projected usage, tends to produce a more accurate cost-benefit outcome and can reduce the time required to recover the initial investment through energy savings.
Which Financing Option Saves You the Most on Solar?
Selecting the appropriate financing method for a solar installation has a direct impact on the total cost savings realized over time. Paying in cash typically yields the greatest financial benefit, as the buyer retains full access to the 30% federal tax credit and incurs no interest charges. Personal loans allow homeowners to spread costs over time while still reducing monthly electricity bills, though the interest accumulated over the loan term diminishes the net savings compared to a cash purchase. A Power Purchase Agreement transfers system ownership to a third party, eliminating upfront costs but generally producing lower long-term savings than outright ownership, since the homeowner pays for the electricity generated rather than benefiting directly from system production. Leasing arrangements similarly reduce electricity bills but require relinquishing federal tax credits and the long-term benefit of cost-free electricity once the system is fully paid off. Independent of the financing method chosen, net metering policies warrant careful consideration, as utility bill credits issued for surplus energy exported to the grid can meaningfully increase the financial return of any solar investment.
Which Tax Credits and Incentives Reduce Your Solar Costs?
Tax credits and incentives can meaningfully reduce the overall cost of solar installation. At the federal level, the Investment Tax Credit (ITC) allows homeowners to deduct 30% of solar installation costs from their federal taxes. Massachusetts residents have access to an additional 15% state solar tax credit, though this is capped at $1,000.
Several other state-level incentives apply in Massachusetts. A sales tax exemption eliminates the state sales tax on solar equipment purchases, and a property tax exemption prevents the added home value from a solar installation from increasing property tax assessments. These provisions reduce both upfront and long-term costs associated with going solar.
Massachusetts also operates the Solar Massachusetts Renewable Target (SMART) program, which provides performance-based incentive payments to solar system owners based on the electricity their systems generate. This creates a recurring revenue stream over the life of the program participation period.
To identify all applicable incentives at the federal, state, and local levels, the Database of State Incentives for Renewables and Efficiency (DSIRE) serves as a comprehensive and regularly updated resource. Consulting this database, along with a qualified tax professional, can help ensure that all available incentives are properly applied and accounted for when calculating the true net cost of a solar installation.
What Are Homeowners Saving on Solar by State?
Solar savings differ considerably based on geographic location, primarily influenced by local electricity rates, required system size, and available incentives. California homeowners see the highest long-term savings at $154,484 over 25 years, a figure largely attributable to the state’s elevated electricity rate of $0.34/kWh. Massachusetts ranks second at $94,627, followed by Arizona at $90,093. Notably, Arizona’s savings are achieved despite relatively lower electricity rates, which necessitate larger system installations to reach comparable savings figures. Florida homeowners can expect $78,959 in savings with a 14.8 kW system. Washington state represents the lower end of the savings spectrum at $36,573, a reflection of the state’s comparatively low energy costs. These figures indicate that local electricity pricing is a primary driver of solar savings potential, making it a key variable when estimating the long-term financial return of a residential solar installation.
How Do You Calculate Your Personal Solar Payback Period?
Calculating the solar payback period requires dividing the final system cost, after applicable incentives, by the annual financial benefit. As an example, a $20,000 system with $6,000 in incentives results in a $14,000 net cost. Dividing that figure by an estimated annual savings of approximately $1,530 produces a payback period of roughly eight to nine years. If electricity rates increase beyond the historical average of 2.8% annually, the payback period may shorten accordingly. After the payback period is reached, the system continues to offset electricity costs for the remainder of its operational lifespan.
Conclusion
Homeowners who install rooftop solar panels can reduce their monthly electricity bills significantly, with savings varying based on location, energy consumption, and system size. Over a 25-year period, cumulative savings can reach up to $154,000, though this figure depends on local electricity rates and available sunlight.
The federal government currently offers a 30% investment tax credit for residential solar installations, which directly reduces the upfront cost of a system. Many states also offer additional financial incentives, including rebates and tax credits, which can further lower installation costs and shorten the payback period.
The average payback period for a residential solar system typically ranges from six to twelve years, depending on installation costs and local energy prices. After this period, homeowners generally experience a net financial gain for the remaining lifespan of the system, which commonly extends 25 to 30 years.
It is worth noting that actual savings will vary by household. Factors such as roof orientation, shading, local utility rates, and net metering policies all influence the financial outcome of a solar installation. Homeowners considering solar should obtain multiple quotes and review their local utility’s policies before making a decision.